![]() PRODUCT LIFE CYCLE (PLC)
PRODUCT LIFE CYCLE (PLC)
Application: Investment Analysis, Strategy, Planning
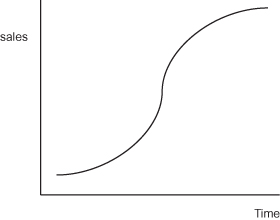
Figure P.6: The typical S-curve depiction of a PLC
The Concept
This irritatingly well known concept suggests that the sales of individual products or services follow a pattern over a period of time, represented by the simple S-curve above. The horizontal axis is time and the vertical is total sales volume.
During the first phase of a product’s life, it is taught, profits are likely to be low because the firm is investing in creating a market, establishing new sales channels, and developing new manufacturing capability. It is suggested that the customers in this early stage are likely to be “early adopters”, who are interested in the new technology and open to new ideas. As their friends, relations, and business contacts see them using the new product, word-of-mouth spreads and demand increases. A moment then comes in the development of the product’s history when it becomes a reliable, familiar proposition and sales boom.
During this phase of the product’s history the suppliers are focused on sales. They are selling almost all they can manufacture as their offer takes off. Profits, which are initially low, improve as the supplier becomes more efficient and processes improve. ...
Get The Marketer's Handbook: Reassessing Marketing Techniques for Modern Business now with the O’Reilly learning platform.
O’Reilly members experience books, live events, courses curated by job role, and more from O’Reilly and nearly 200 top publishers.

