Maps
Dashboard Design contains roughly 100 maps, which represent confidence, countries, regions, and states. These are used to display data for various geographical regions.
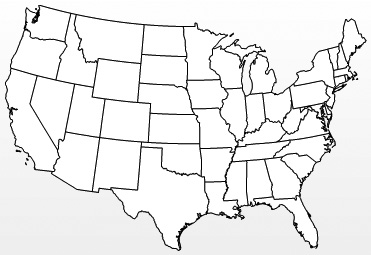
As with other components within Dashboard Design, a map component can also be used as a selector. For example, users can view a map containing sales by state and click a state to see a detailed chart representing monthly sales for that state.
Get SAP BusinessObjects BI 4.0 The Complete Reference 3/E now with the O’Reilly learning platform.
O’Reilly members experience books, live events, courses curated by job role, and more from O’Reilly and nearly 200 top publishers.

