Configuring live charts
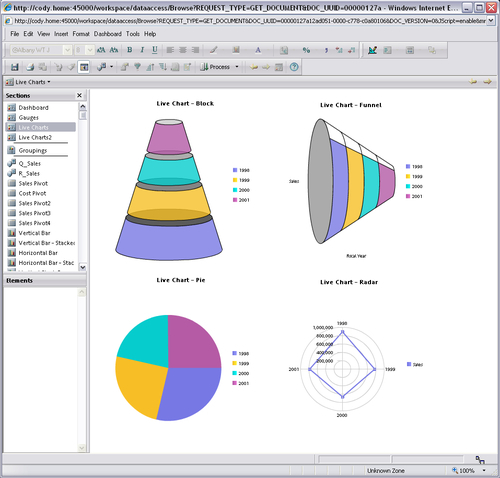
Configuring the live chart objects is similar to configuring gauges. When a live chart is added to a dashboard, the live chart must be populated with data from a Query section. Additionally, the properties of the live chart can be modified to produce the desired chart display of interest. The next two screenshots are examples of the six types of live charts available for use in the document. The following screenshot shows the Block, Pie, Funnel, and Radar live charts:
The following screenshot displays an example of a Bar and Line live chart:
When the dashboard is under design, clicking and highlighting the live chart will ...
Get The Business Analyst's Guide to Oracle Hyperion Interactive Reporting 11 now with the O’Reilly learning platform.
O’Reilly members experience books, live events, courses curated by job role, and more from O’Reilly and nearly 200 top publishers.

