Configuring gauges
When a gauge is added to a dashboard, the gauge must be populated with data elements from a Query section, and the properties of the gauge can be configured to produce the desired view of interest. The following image is a sample of each of the four gauges on a dashboard:
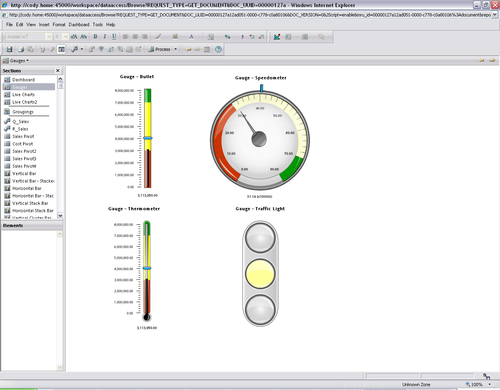
Each gauge contains a Fact element and all of the gauges besides the Traffic Light contain a Target Fact element. When a gauge is clicked and highlighted on the dashboard during design, a Data Layout window appears at the bottom of the main screen with areas to add data elements from Query results or a table. Dragging-and-dropping the desired elements from the ...
Get The Business Analyst's Guide to Oracle Hyperion Interactive Reporting 11 now with the O’Reilly learning platform.
O’Reilly members experience books, live events, courses curated by job role, and more from O’Reilly and nearly 200 top publishers.

