The simple Release Burndown chart tracks the total number of points remaining after each iteration. The dotted red line traces the trajectory of the burndown rate, and where it intersects the black horizontal line is the prediction of when the release will complete.
A simple Release Burndown looks like this:
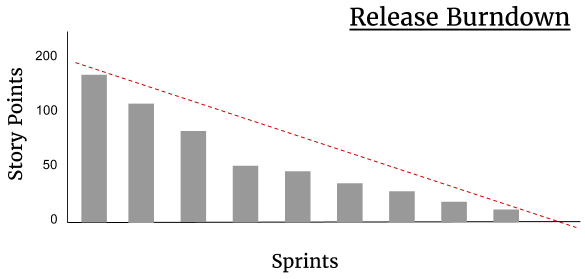
This chart is easy to maintain; it's just a case of adding up the Story Points remaining at the end of each Sprint. However, it isn't always apparent from this chart what has taken place in each Sprint. To illustrate, look at iteration five. The velocity for the team was just as high as it was in iteration ...

