The computational graph of initializing a variable as a tensor of zeros is shown in the following diagram:
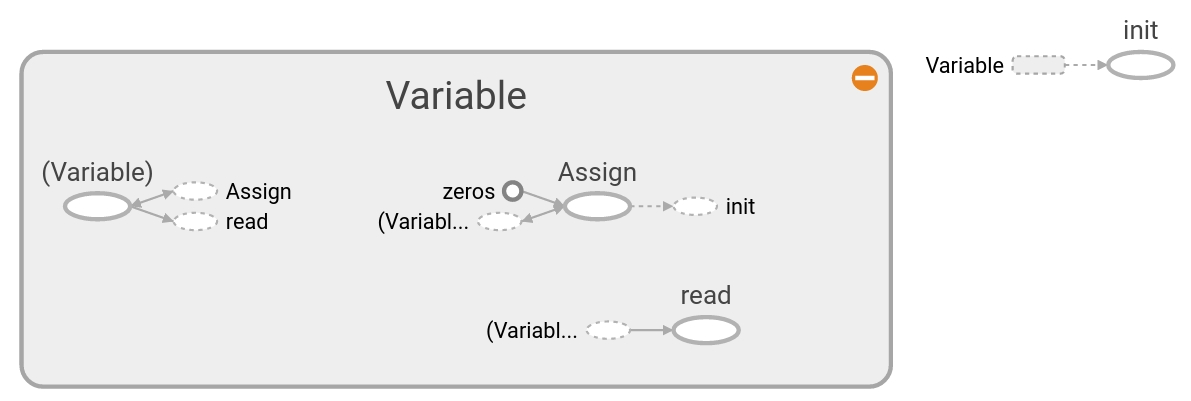
Figure 1: Variable
Here, we can see what the computational graph looks like in detail with just one variable, initialized all to zeros. The grey shaded region is a very detailed view of the operations and constants that were involved. The main computational graph with less detail is the smaller graph outside of the grey region in the upper-right corner. For more details on creating and visualizing graphs, see the first section of Chapter 10, Taking TensorFlow to Production. Similarly, the computational graph of feeding ...

