The visualized graph looks better with the naming of operations and scoping of layers. We can collapse and expand the custom layer because we created it in a named scope. In the following diagram, see the collapsed version on the left and the expanded version on the right:
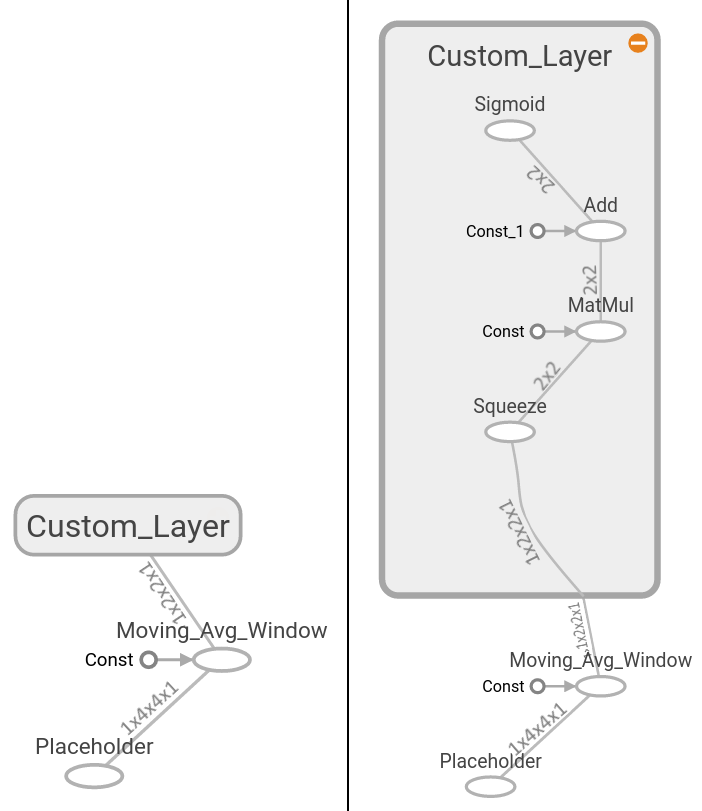
Figure 3: Computational graph with two layers
The first layer is named Moving_Avg_Window. The second is a collection of operations called Custom_Layer. It is collapsed on the left and expanded on the right.

