Chapter 3. Drawing Pictures
Pictures carry much of the story in a good software requirements document. By pictures, I mean diagrams, and not just any diagrams, but a specific type called a data flow diagram.
A good data flow diagram can show what a system does, what goes in, what comes out, and where it all goes in much less space and with more precision than is possible with text alone.
A data flow diagram neatly condenses the work of a system into a series of processes and shows the output, products, or data that result from each process. Because of this focus on processes, inputs, and outputs, data flow diagrams are especially well suited to capturing and communicating requirements.
When I teach this, one of my favorite exercises is to choose someone from the class who has no related experience and ask them to tell me what is happening in a diagram like the one that follows.
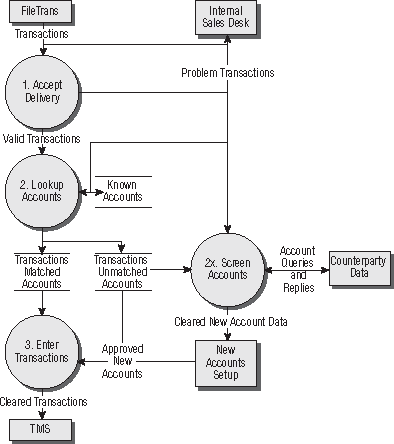
Nearly everyone gets the basic idea and most are able to explain the basic functions of the system in considerable detail.
The data flow diagram exists in various versions. It was formally defined by Larry Constantine in the IBM Systems Journal based on Martin and Estrin's "data flow graph" model of computation.[6] Ed Yourdon and Tom Demarco refined and popularized data flow diagramming as a major component of Structured Analysis.[7] Other diagramming techniques have become popular recently among engineers, mainly ...
Get Telling Stories: A Short Path to Writing Better Software Requirements now with the O’Reilly learning platform.
O’Reilly members experience books, live events, courses curated by job role, and more from O’Reilly and nearly 200 top publishers.

