21.8. Regression
21.8.1. Curve Fitting
In statistics, curve fitting, the fitting of a curve to a set of data points, is called regression. The fitting of a straight line to data points is called linear regression, while the fitting of some other curve is called nonlinear regression. Fitting a curve to two sets of data is called multiple regression. We will cover linear regression in this section.
|
The word regression was first used in the nineteenth century when these methods were used to determine the extent by which the heights of children of tall or short parents regressed or got closer to the mean height of the population. |
▪ Exploration:
Try this. Graph the following sets of data:
| x | 0 | 1 | 2 | 3 | 4 | 5 | 6 | 7 | 8 | 9 | 10 |
| y | 2 | 4 | 5 | 4 | 4 | 7 | 5 | 8 | 7 | 6 | 8 |
| x | 0 | 1 | 2 | 3 | 4 | 5 | 6 | 7 | 8 | 9 | 10 |
| y | 8 | 7 | 7 | 6 | 5 | 4 | 7 | 3 | 2 | 2 | 1 |
| x | 0 | 1 | 2 | 3 | 4 | 5 | 6 | 7 | 8 | 9 | 10 |
| y | 4 | 1 | 9 | 7 | 4 | 6 | 2 | 8 | 0 | 3 | 9 |
Figure 21.27. FIGURE 21-27
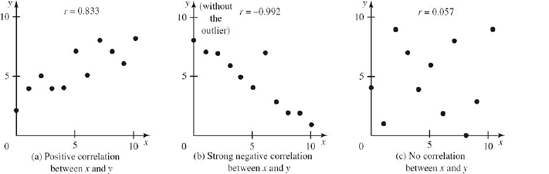
You should have produced graphs that look like those in Fig. 21-27.
What can you say about the relationship between x and y in these graphs? In (a) we could probably draw a line that would approximate the data points, and most of the points would fall near the line, but not on it. To be more technical, we could say that x and y are moderately correlated. We also notice that y increases as x gets larger. Therefore we can say that there is a positive correlation between x and y. Another way to think of this is that the slope of the line we draw to approximate the points is positive.
For (b) there ...
Get Technical Mathematics, Sixth Edition now with the O’Reilly learning platform.
O’Reilly members experience books, live events, courses curated by job role, and more from O’Reilly and nearly 200 top publishers.

