15.4. Graphs of the Other Trigonometric Functions
15.4.1. The Cosine Wave
▪ Exploration:
Try this. Graph at least one cycle of y = sin x. Then on the same axes, graph y = cos x.
How are the two waves similar? How do they differ? How would you obtain one from the other?
15.4.2. Cosine and Sine Curves Related
Note in Fig. 15-19 and in the calculator screen that the cosine curve and the sine curve have the same shape. In fact, the cosine curve appears to be identical to a sine curve shifted 90° to the left, or
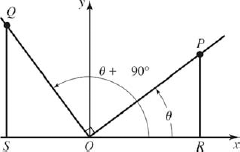
cos θ = sin(θ + 90°)We can show that Eq. 1 is true. We lay out the two angles θ and θ + 90° (Fig. 15-20), choose points P and Q so that OP = OQ, and drop perpendiculars PR and QS to the x axis. Since triangles OPR and OQS are congruent, we have OR= QS. The cosine of θ is then
![]()
which verifies Eq. 1.
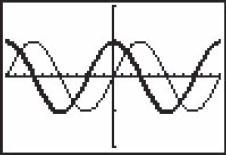
Calculator graphs of y = sin x, shown light, and y = cos x, shown heavy. Tick marks are 30° apart on the x axis and one unit apart on the y axis.
Figure 15.19. Manual graphs of y = sin x and y = cos x.
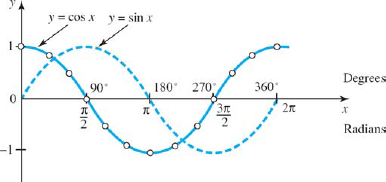
Figure 15.20. FIGURE 15-20
15.4.3. Graph of the General Cosine Function
Get Technical Mathematics, Sixth Edition now with the O’Reilly learning platform.
O’Reilly members experience books, live events, courses curated by job role, and more from O’Reilly and nearly 200 top publishers.

