15.1. Graphing the Sine Wave by Calculator
▪ Exploration:
Try this. Using your graphing calculator, graph y = sin x. A trigonometric function is graphed the same way as we graphed other functions in Chapter 5. Enter the function in the ![]() editor, put the calculator into DEGREE mode, set the viewing window from −100 to +800 on the x axis, and −2 to +2 on the y axis, and press
editor, put the calculator into DEGREE mode, set the viewing window from −100 to +800 on the x axis, and −2 to +2 on the y axis, and press ![]() .
.
What is different about this curve than others we have studied? What are the maximum and minimum values of y? Are there maximum and minimum values of x? Increase the width of the window. Does the curve seem to repeat? How often?
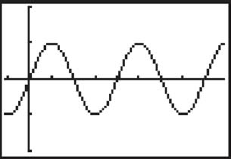
Screen for y = sin x from the exploration. Ticks on the vertical axis are one unit apart, and on the horizontal axis are 90° apart, so the period is 360° per cycle. Some calculators can automatically set the viewing window for trigonometric graphs. On TI calculators, it is called ZTrig and is in the ![]() menu. However, that window may not always be the best for a particular graph.
menu. However, that window may not always be the best for a particular graph.
15.1.1. Periodic Functions
A curve that repeats its shape over and over, like the sine wave in our exploration, ...
Get Technical Mathematics, Sixth Edition now with the O’Reilly learning platform.
O’Reilly members experience books, live events, courses curated by job role, and more from O’Reilly and nearly 200 top publishers.

