5.2. Graphing an Equation
In the preceding section we graphed a function that was given in the form of a table of point pairs. Now we will graph a function given in the form of an equation. Our first example will be an equation in explicit form and our second example will be an equation in implicit form. Then we will graph a relation given in the form of an equation.
To graph an equation, we first obtain a set of point pairs by substituting values of x into the equation, one at a time, and computing the corresponding values of y. We then plot each point pair. We connect these with a smooth curve, unless we have reason to believe that there are corners, breaks, or gaps in the curve. Our first graph will be of the straight line.
Example 5:Graph the equation
for integer values of x from −2 to +2. Solution: We first obtain a table of point pairs. Substituting into the equation we get,
We plot these point pairs and connect with a smooth curve, Fig. 5-7. Had we known in advance that the graph would be a straight line, we could have saved time by plotting just two points, with perhaps a third as a check. Later in this chapter we will cover the straight line in more detail and show another way to graph it. |
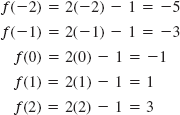
Figure 5.7. A first-degree equation will always plot as a straight line—hence the name linear equation.
NOTE
Be especially careful when substituting negative ...
Get Technical Mathematics, Sixth Edition now with the O’Reilly learning platform.
O’Reilly members experience books, live events, courses curated by job role, and more from O’Reilly and nearly 200 top publishers.

