15.5. Graphing a Parametric Equation
For the equations we have graphed so far, in rectangular coordinates, y has been expressed as a function of x.
- y = f(x)
But x and y can also be related to each other by means of a third variable, say, t, if both x and y are given as functions of t.
- x = g(t)
and
- y = h(t)
Figure 15.29. FIGURE 15-29

Such equations are called parametric equations. The third variable t is called the parameter.
To graph parametric equations, we assign values to the parameter t and compute x and y for each t. We then plot the table of (x, y) pairs.
Example 24:Graph the parametric equations
for t = −3 to 3. Solution: We make a table with rows for t, x, and y. We take values of t from −3 to 3, and for each we compute x and y.
We now plot the (x, y) pairs, (−6, 7), (−4, 2), ..., (6, 7) and connect them with a smooth curve (Fig. 15-29). The curve obtained is a parabola, the same curve we graphed in an earlier chapter, but obtained here with parametric equations. |
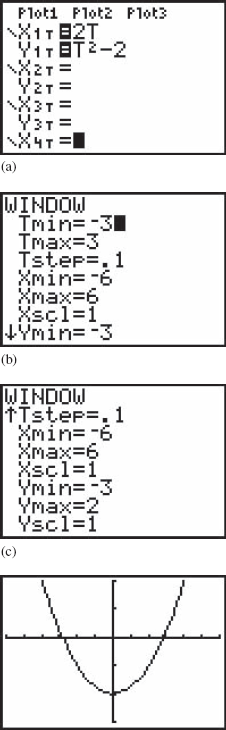
(d) Graph of x = 2t and y = t2 − 2. Tick marks are 1 unit apart on both axes.
15.5.1. Graphing Parametric Equations by Calculator
We will show how to do this with an example.
Example 25:Repeat Example 23 by calculator. Solution: We first set the calculator ... |
Get Technical Mathematics, Sixth Edition now with the O’Reilly learning platform.
O’Reilly members experience books, live events, courses curated by job role, and more from O’Reilly and nearly 200 top publishers.

