Chapter 17. Graphs Are Novel and Charts Are Off the Chart
In This Chapter
Getting the most value out of graphs and charts
Discovering the most important chart types
Deciphering charts and graphs (and evaluating their quality)
Creating great graphs
You've probably heard of graphic novels — stories told in pictures. Many people love them because pictures communicate so much (they're worth 1,000 words, after all).
Even if graphic novels aren't your thing, you've certainly heard of and used charts — if you've ever used a road map (a visual representation of geography and distance), you've used a kind of chart.
Graphs and charts are the mathematical equivalents of these everyday items. They may not be as exciting as manga (the picture stories so popular in Japan), but mathematical charts and graphs easily explain information and concepts and help you effectively communicate ideas to other people.
In this chapter, you discover the types of graphs and their parts and become an expert in reading and making them.
Defining Charts and Graphs and Their Advantages
In practical math, a graph and a chart are the same thing. They both refer to a graphic that shows tabular data in a visual form, otherwise known as an information graphic. You can pretty much use the words chart and graph interchangeably.
Figure 17-1 shows some typical types of charts and graphs. Don't worry yet about what the types are.
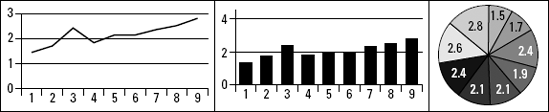
Figure 17.1. Types ...
Get Technical Math For Dummies® now with the O’Reilly learning platform.
O’Reilly members experience books, live events, courses curated by job role, and more from O’Reilly and nearly 200 top publishers.

