Trading with Candlesticks
Now put some of the basic candle formations to work, with other technical indicators, to analyze a real market situation.
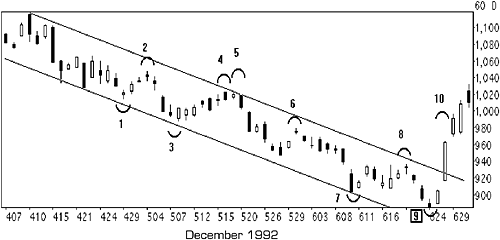
Figure 33.2 shows cocoa futures from April through June 1992. The biggest question a trader would ask during this period is, “When will this market stop going down?” There are several patterns on the chart that forecasted times for corrections and finally, the end of the decline. Using candlesticks with other confirming technical indicators lets you figure out which is which.
Figure 33.2. Cocoa futures

The market was trending lower and at the bottom of the channel. The gap lower (called a window) ...
Get Technical Analysis Plain and Simple: Charting the Markets in Your Language, Second Edition now with the O’Reilly learning platform.
O’Reilly members experience books, live events, courses curated by job role, and more from O’Reilly and nearly 200 top publishers.

