Quick Visual Analysis
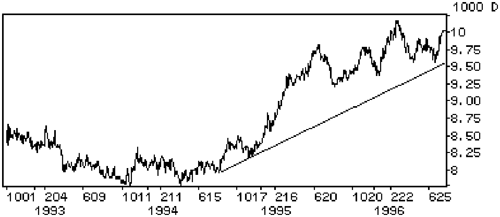
Figures 18.5 to 18.10 show the same four-year period for major world stock markets relative to the world index starting with the U.S. market’s outperformance versus the world index from 1994-1996. Quick trendline analysis shows the UK market, as represented by the FTSE 100 (Figure 18.6), has broken a trendline to the upside and is therefore suggesting that it will outperform the world for a while. Hong Kong (Figure 18.7) has been matching the world pace for 2 1/2 years, and France (Figure 18.8), Australia (Figure 18.9), and Germany (Figure 18.10) are locked in three-year down trends.
Figure 18.5. U.S./World

Figure 18.6. ...
Get Technical Analysis Plain and Simple: Charting the Markets in Your Language, Second Edition now with the O’Reilly learning platform.
O’Reilly members experience books, live events, courses curated by job role, and more from O’Reilly and nearly 200 top publishers.

