Part V
Dynamic Analysis
 Visit www.dummies.com/extras/technicalanalysis for great Dummies content online.
In this part…
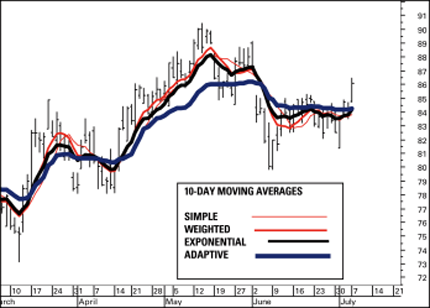
- Learn that a moving average is an arithmetic method of smoothing price numbers so that you can see and measure a trend. A straight line is a good visual organizing device, but a dynamic line — the moving average — more accurately describes what's really going on.
- Find out that momentum (the speed of a price change) is the single best tool for detecting when a trend is about to end rather than just putting in a minor pullback.
- Get the scoop on the Bollinger band, the most popular way traders incorporate consideration of volatility into their trading plans.
- Understand how point-and-figure charting strips away time and displays only significant prices on the chart, resulting in filtered price action.
- Survey some combinations of techniques and get some guidance on the process of putting techniques together to forge a systematic approach to trading.
- Check out how the financial cycle follows the economic and business cycles but with the addition of something new — risk management.
Get Technical Analysis For Dummies, 3rd Edition now with the O’Reilly learning platform.
O’Reilly members experience books, live events, courses curated by job role, and more from O’Reilly and nearly 200 top publishers.

