CHAPTER 12
Working with Charts
Create a Chart
You can quickly convert your spreadsheet data into easy-to-read charts. You can create column, line, pie, bar, area, scatter, stock, surface, doughnut, bubble, and radar charts. Excel even recommends the type of chart that works best for your data. If you do not like Excel’s recommendations, you can select the chart of your choice.
You can create charts using the Ribbon or using the Quick Analysis button. After you create a chart, you can use buttons beside the chart or on the Chart Tools tabs to fine-tune the chart to best display and explain the data.
Create a Chart
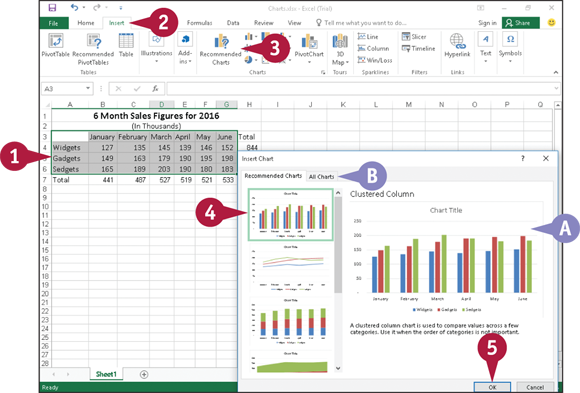
Using the Ribbon
Select ...
Get Teach Yourself VISUALLY Office 2016 now with the O’Reilly learning platform.
O’Reilly members experience books, live events, courses curated by job role, and more from O’Reilly and nearly 200 top publishers.

