CHAPTER 5
Adding Charts and Tables
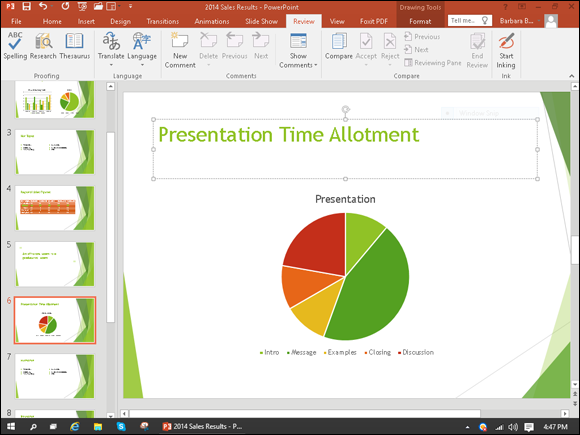
Charts and tables give your audience a visual reference when you talk about figures or make comparisons, especially when comparing or reporting on more than two items — for example, regional sales figures for your company’s product line. You enter your data and then PowerPoint works its magic to turn your data into colorful, informative graphic representations.

Insert a Table
You can use a table to arrange information in rows and columns for easy data comparison. ...
Get Teach Yourself VISUALLY PowerPoint 2016 now with the O’Reilly learning platform.
O’Reilly members experience books, live events, courses curated by job role, and more from O’Reilly and nearly 200 top publishers.

