9. Analyzing Text Through Visualization
One of the most powerful forms of analytics is that of visualization. With visualization, information “pops out” that would not otherwise be obvious. Visualization makes obvious what would otherwise be difficult to discern.
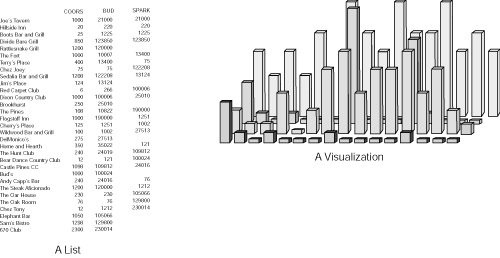
Figure 9-1 shows a list of numbers. From the list of numbers is a visualization, which immediately brings out aspects of the list of numbers that would otherwise be difficult to see.
Figure 9-1 Which of these portrayals is most meaningful?

There are all sorts of visualizations: pie charts, Pareto charts, straight line point-to-point graphic depictions, scatter diagrams. Each type of ...
Get Tapping into Unstructured Data: Integrating Unstructured Data and Textual Analytics into Business Intelligence now with the O’Reilly learning platform.
O’Reilly members experience books, live events, courses curated by job role, and more from O’Reilly and nearly 200 top publishers.

