APPENDIX B
Tableau Data Shaper Excel Plug-In
If you rely on spreadsheet or text files as datasources, you'll probably need to reshape the data to facilitate analysis. Reshaping data manually can be time-consuming. Fortunately, Tableau has provided an Excel add-in tool that makes reshaping data fast and easy.
WHY IS RESHAPING DESIRABLE?
Figure B-1 is a typical format for spreadsheet data. The data presented includes revenue categories and time series information.
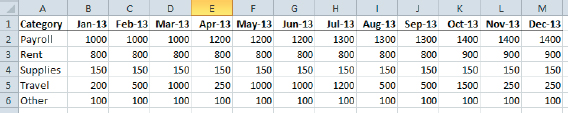
FIGURE B-1 Spreadsheet data
While Figure B-1 is conducive for analyzing data in a spreadsheet, it isn't optimal for analysis using Tableau. Each row below the headings will be interpreted as dimensions:
- Payroll
- Rent
- Supplies
- Travel
- Other
The problem is in how the columns will be interpreted. Each column represents the same measure (expense amounts), but because the expenses are divided by month, Tableau will interpret each column as a separate measure. This isn't how a database would store the information. Attaching Tableau to this datasource won't provide the flexibility you'll require. Figure B-2 shows how Tableau interprets the spreadsheet.
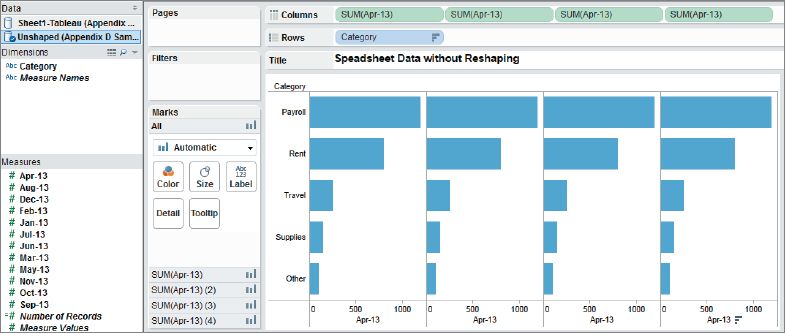
FIGURE B-2 Tableau connected to original data
In Figure B-2 you can see that each column of the spreadsheet is interpreted as a separate measure. This makes time series analysis ...
Get Tableau Your Data!: Fast and Easy Visual Analysis with Tableau Software now with the O’Reilly learning platform.
O’Reilly members experience books, live events, courses curated by job role, and more from O’Reilly and nearly 200 top publishers.

