CHAPTER 12
Use Cases for Rapid-Fire Visual Analytics
Relating a few stories about how people are deploying and using Tableau will hopefully inspire you to think of ways you can use it to turn data into understandable information. The case studies presented include a variety of industries, healthcare, and education. Keep an eye on the book's companion website for additional case studies and additional example material.
RAPID-FIRE ANALYSIS AT A PUBLIC UTILITY
Newnan Utilities is a local water utility in Newnan, Georgia. The company has experienced significant fluctuations in call volume within their call center that were proving to be challenging to resolve. Traditional call center software was too expensive. Director of Administration, Jeff Phillips, and Business Analyst, Paul Lisborg, were charged with solving the problem. They achieved this goal by using Tableau Software to visualize the data that was already being captured by their telephone system database. Figure 12-1 shows an example call analysis dashboard.
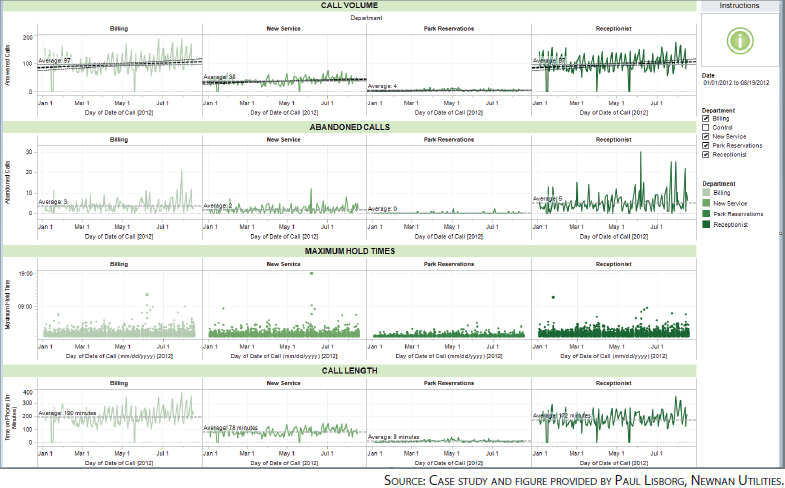
FIGURE 12-1 Call analysis dashboard
This dashboard has a number of desirable attributes. When users point at the instruction icon in the upper right side of the dashboard, they receive detailed navigation instructions regarding navigation and filtering. The dashboard provides time series analysis of call volume for selected departments and information on abandoned calls, ...
Get Tableau Your Data!: Fast and Easy Visual Analysis with Tableau Software now with the O’Reilly learning platform.
O’Reilly members experience books, live events, courses curated by job role, and more from O’Reilly and nearly 200 top publishers.

