Using polygon shapes
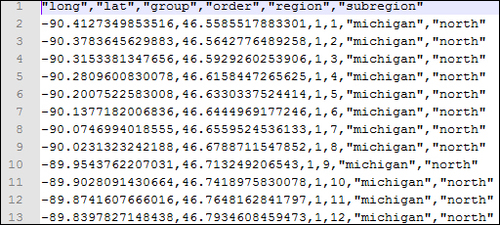
Tableau 7 and above have a functionality to create filled maps using fill map marks. These marks are useful when your levels of detail (or the shape of the filled area) are limited to the US counties or county/state combinations. If you want to create custom-shaded maps using geographical boundaries, such as districts of India, you have to use the following steps. You can create such filled maps using a polygon file, which consists of latitude and longitude of various points on the boundaries or shapes of the custom region. An example of such a file is shown in the following screenshot:
Getting ready
We'll plot the sales figures ...
Get Tableau: Creating Interactive Data Visualizations now with the O’Reilly learning platform.
O’Reilly members experience books, live events, courses curated by job role, and more from O’Reilly and nearly 200 top publishers.

