Pivoting columns
In this recipe, we will prepare the data set that we used in the Creating a population pyramid recipe of Chapter 2, Advanced Charts. The original file, which is a comma separated value (CSV) file, looks like the following:
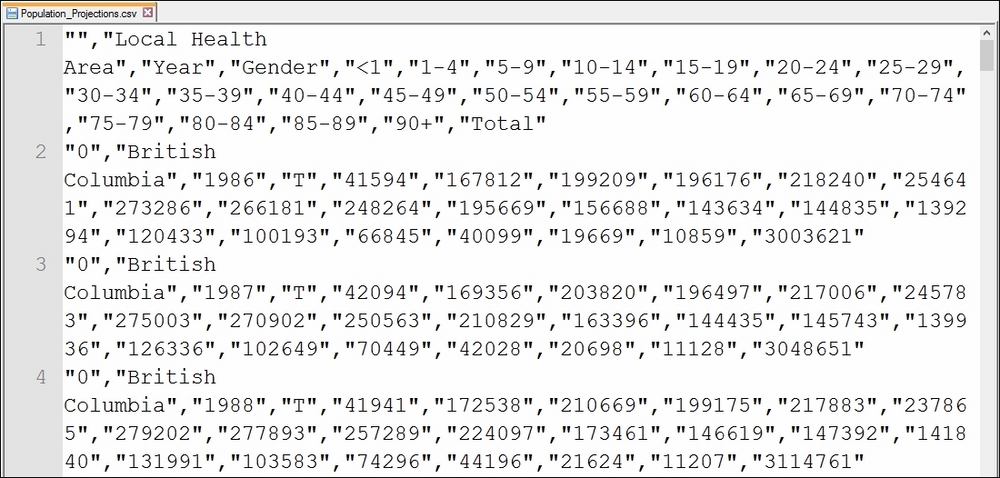
Getting ready
To follow this recipe, download the file from BCStats using the following URL:
http://www.bcstats.gov.bc.ca/StatisticsBySubject/Demography/PopulationProjections.aspx.
When you download, make the following selections and click on Generate Output:
- Select British Columbia for Region
- Select all the years
- Select totals
- Select 5-Year Age Groups
Beside the result pane, click on the CSV icon at the top-right corner ...
Get Tableau 10 Business Intelligence Cookbook now with the O’Reilly learning platform.
O’Reilly members experience books, live events, courses curated by job role, and more from O’Reilly and nearly 200 top publishers.

