Adding a trend line
Trend lines are typically added to charts to visualize general patterns or movement. An upward trend suggests the two variables being used on the axes are directly proportional, meaning as one value goes up, the other one tends to go up. A downward trend may suggest an inverse relationship between the variables, meaning as one value goes up, the other one goes down.
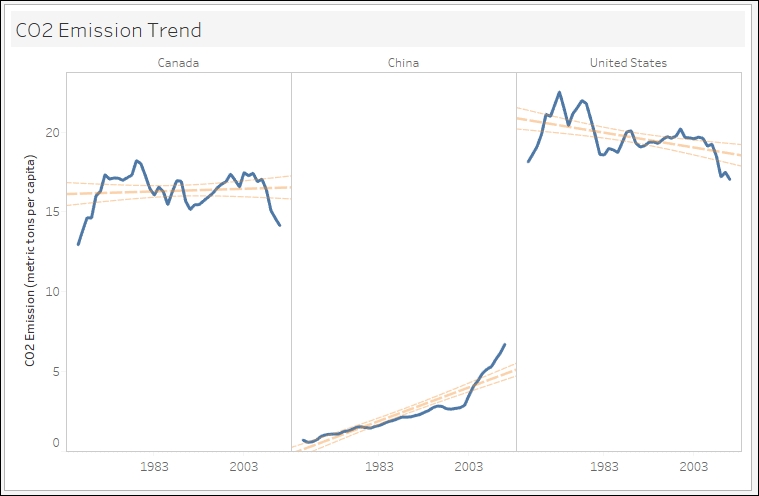
In this recipe, we will add trend lines for the CO2 emissions of Canada, China, and United States:
Getting ready
To follow this recipe, open B05527_06 – STARTER.twbx. Use the worksheet called Trend Line, and connect to the CO2 (Worldbank) data source:
How to do it... ...
Get Tableau 10 Business Intelligence Cookbook now with the O’Reilly learning platform.
O’Reilly members experience books, live events, courses curated by job role, and more from O’Reilly and nearly 200 top publishers.

