Adding a constant line
A constant line is simply a line we add to a graph that has a value that doesn't change. This value is typically hardcoded (or set) and is not determined by other values in the graph. For example, if we wanted to show the value of pi (3.1415927 – depending on the precision you want to show), we can use a constant line.
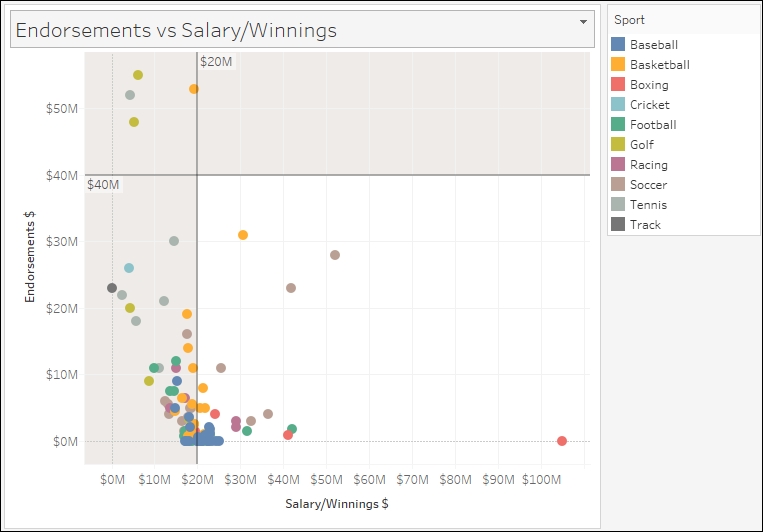
In this recipe, we will add constant reference lines to visualize players who, relatively, are earning less in salary but getting more in endorsements:
Getting ready
To follow this recipe, open B05527_06 – STARTER.twbx. Use the worksheet called Constant Line, and connect to the Top Athlete Salaries (Global Sport ...
Get Tableau 10 Business Intelligence Cookbook now with the O’Reilly learning platform.
O’Reilly members experience books, live events, courses curated by job role, and more from O’Reilly and nearly 200 top publishers.

