Creating an Infographic-like dashboard
Infographics is a shortened term for information graphics, which is a way to visualize data using a lot of graphics and is designed to make the make the visual more graphic and eye-catching. Tableau has the components to add more visual elements to a dashboard and making it look more like the typical infographic.
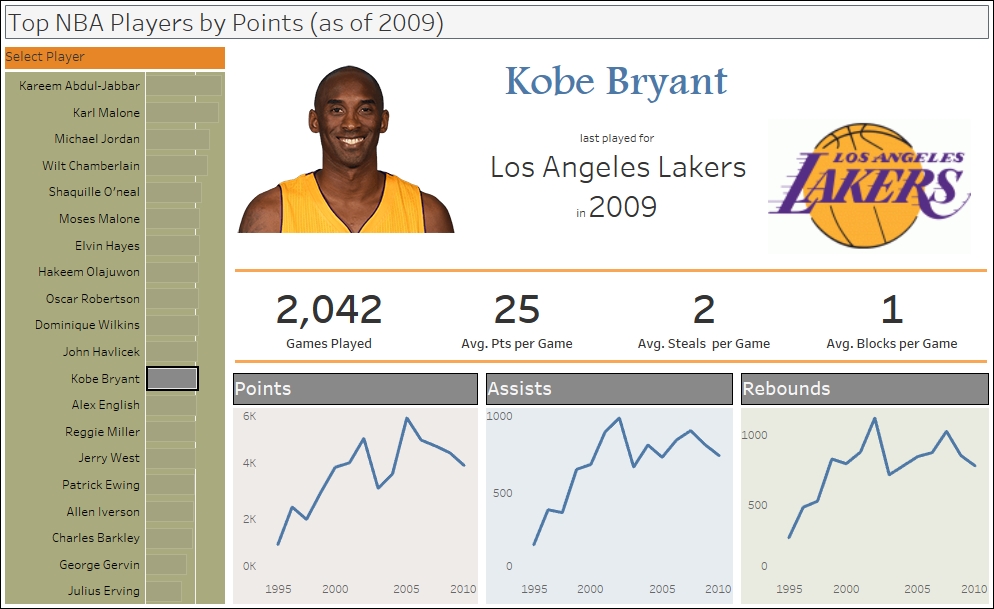
In this recipe, we will create an infographic-like dashboard that incorporates free form images and text.
Getting ready
To follow this recipe, open B05527_04 – STARTER.twbx. We will use the following worksheets:
- Top Players
- Player Points
- Player Assists
- Player Rebounds
- Player Name
- Player Stats
- Player last played ...
Get Tableau 10 Business Intelligence Cookbook now with the O’Reilly learning platform.
O’Reilly members experience books, live events, courses curated by job role, and more from O’Reilly and nearly 200 top publishers.

