Creating a population pyramid
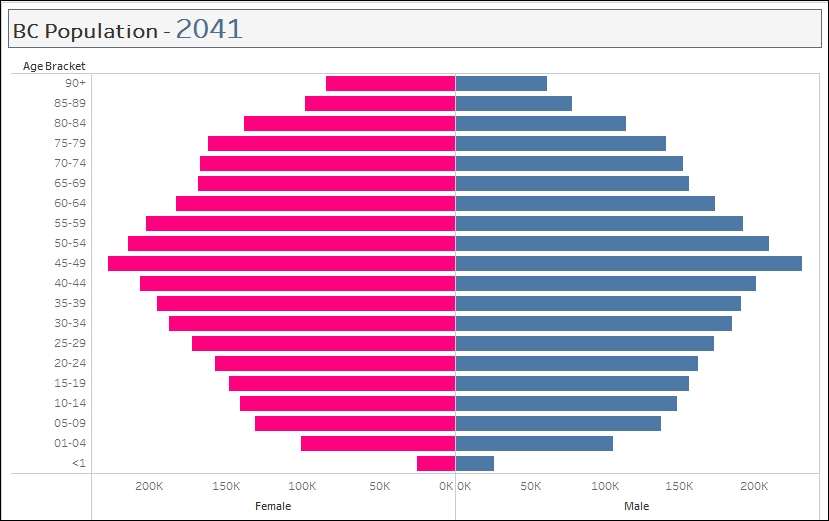
A population pyramid is a chart that shows population distribution by age and gender. Age is typically distributed using five-year age groups. The youngest groups are located at the base and the oldest groups at the top. Population pyramids can indicate how slow or fast the population ages, and can also be used to forecast how the population will change in the future.
In this recipe, we will create British Columbia's population pyramid from 1986 to 2041.
Getting ready
To follow this recipe, open B05527_02 – STARTER.twbx. Use the worksheet called Population Pyramid, and connect to the BC Population Projection data source. ...
Get Tableau 10 Business Intelligence Cookbook now with the O’Reilly learning platform.
O’Reilly members experience books, live events, courses curated by job role, and more from O’Reilly and nearly 200 top publishers.

