Creating a box and whisker chart
Box and whisker plots, also called box plots, are charts that divide their data points into quartiles. Box plots are great at comparing distributions of data for different groups or categories side by side.
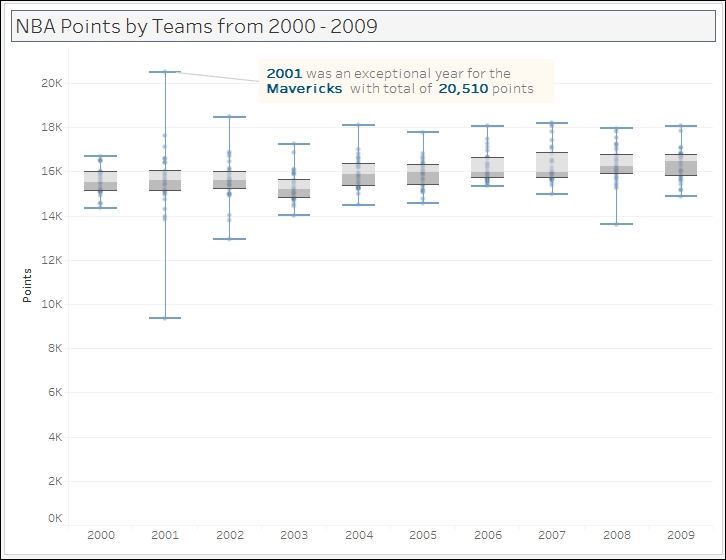
In this recipe, we will create a box and whisker plot that shows the spread of points garnered by NBA teams from 2000-2009.
Getting ready
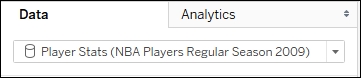
To follow this recipe, open B05527_02 – STARTER.twbx. Use the worksheet called Box and Whisker, and connect to the Player Stats (NBA Players Regular Season 2009) data source.
How ...
Get Tableau 10 Business Intelligence Cookbook now with the O’Reilly learning platform.
O’Reilly members experience books, live events, courses curated by job role, and more from O’Reilly and nearly 200 top publishers.

