Creating a unit chart
Unit charts, also referred to as pictogram charts, display each unit of measure as a single mark or symbol. While other types of charts may be more effective and less cluttered, unit charts may create more engagement because of the images and visuals used.
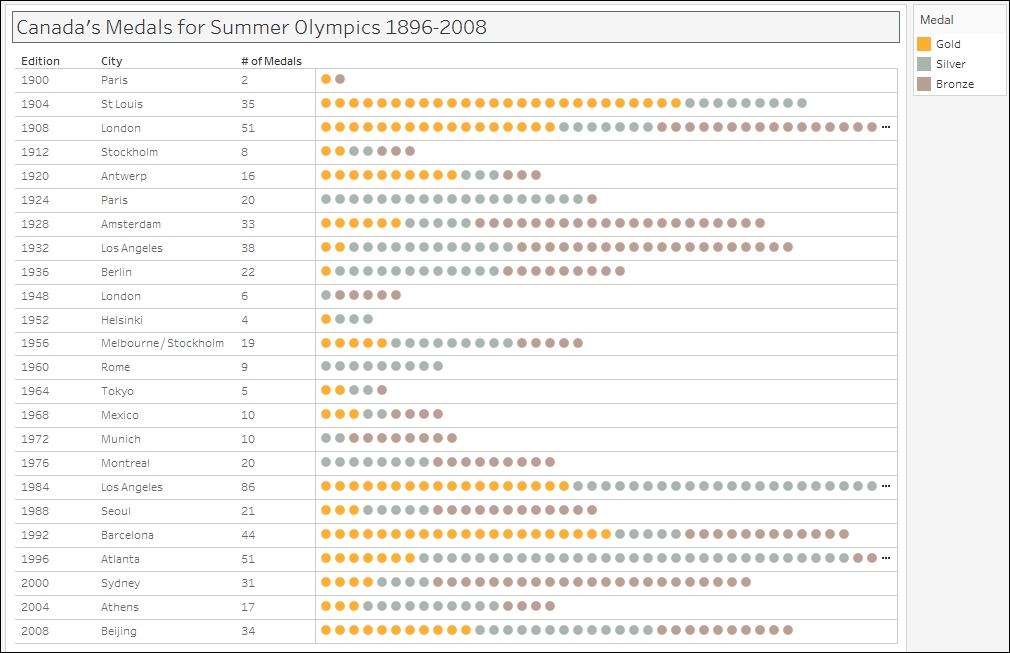
In this recipe, we will create a unit chart that shows all the medals that were won by Canada in the Summer Olympics from 1896-2008.
Getting ready
To follow this recipe, open B05527_02 – STARTER.twbx. Use the worksheet called Unit Chart, and connect to the ALL MEDALISTS (Summer_Olympic_medallists_1896-2008) data source.
How to do it...
The following are the steps to create a unit ...
Get Tableau 10 Business Intelligence Cookbook now with the O’Reilly learning platform.
O’Reilly members experience books, live events, courses curated by job role, and more from O’Reilly and nearly 200 top publishers.

