Creating a donut chart
A donut chart, like a pie chart, shows part-to-whole relationships. And like a traditional donut (the sweet, edible kind), it has a hole in the middle.
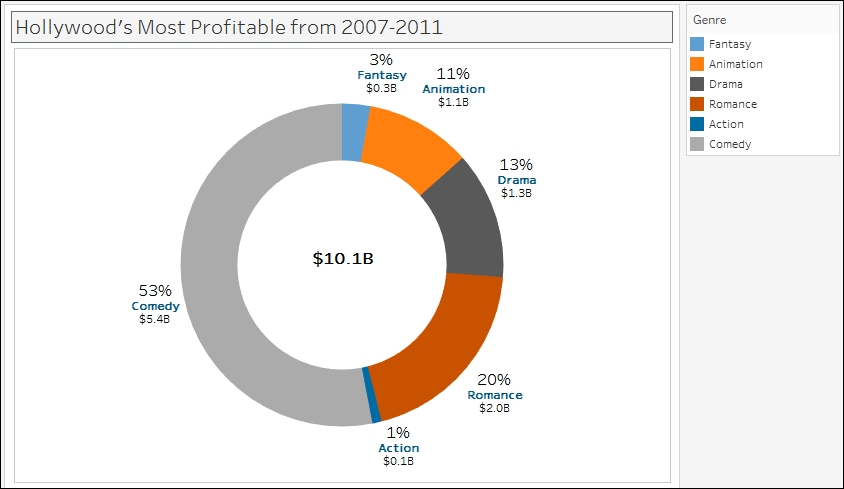
In this recipe, we will create a donut chart that shows the breakdown of Hollywood's top movies from 2007-2011 by genre.
Getting ready
To follow this recipe, open B05527_02 – STARTER.twbx. Use the worksheet called Donut, and connect to the HollywoodMostProfitableStories data source.
How to do it...
The following are the steps to create a donut chart:
- Change the mark type to Pie in ...
Get Tableau 10 Business Intelligence Cookbook now with the O’Reilly learning platform.
O’Reilly members experience books, live events, courses curated by job role, and more from O’Reilly and nearly 200 top publishers.

