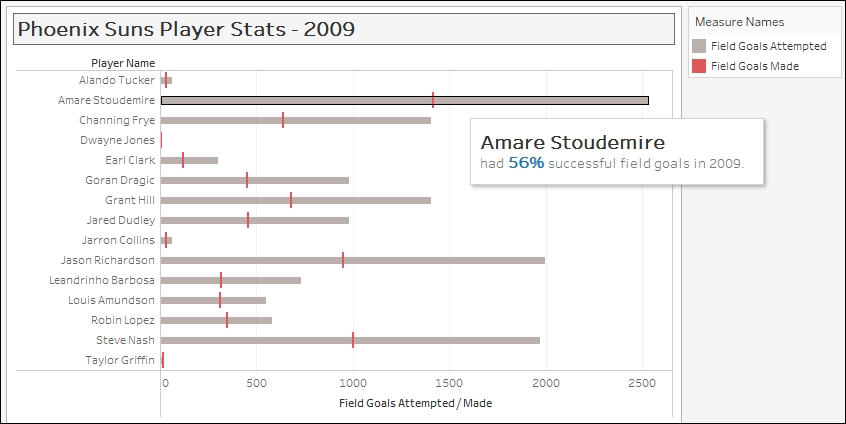
Creating a combo chart (dual axis chart)
A dual axis chart is a chart that uses two axes for two different measures. This chart is useful when two measures have different types or ranges (for example, monetary value and percentage), or if the two measures need to be displayed differently (for example, one as a bar and one as a line).
In this recipe, we will create a dual axis chart, also often referred to as a combo chart.
Getting ready
To follow this recipe, open B05527_02 – STARTER.twbx. Use the worksheet called Combo Chart Dual Axis, and connect to the Player Stats (NBA Players Regular Season 2009) data source.
How to do it...
The following are the ...
Get Tableau 10 Business Intelligence Cookbook now with the O’Reilly learning platform.
O’Reilly members experience books, live events, courses curated by job role, and more from O’Reilly and nearly 200 top publishers.

