Creating a tree map
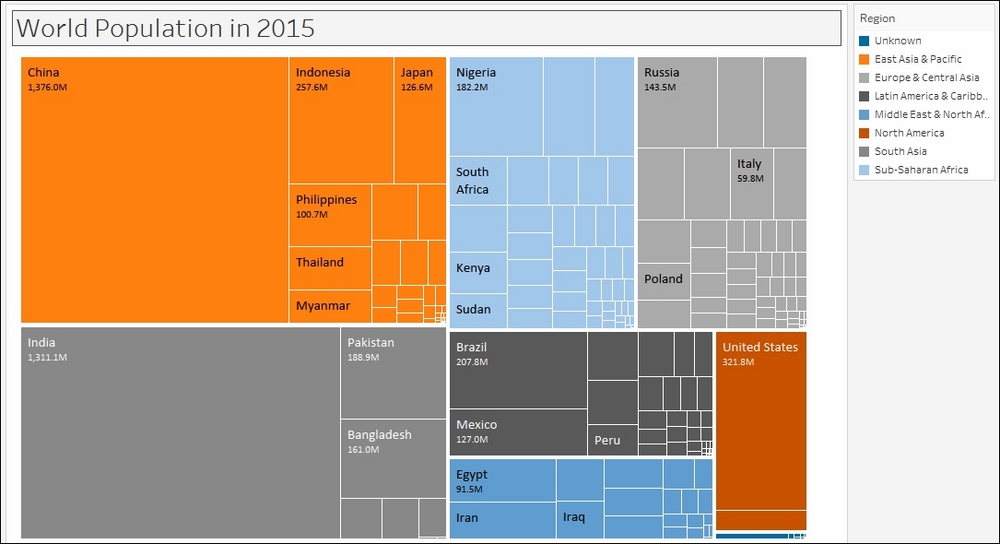
Tree maps represent part-to-whole and hierarchical relationships using a series of rectangles. The sizes and colors of rectangles will vary based on the values they represent. Typically, the larger rectangles, or rectangles with most concentrated colors, depict the highest values.
In this recipe, we will represent the 2015 world population as a tree map.
Getting ready
To follow this recipe, open B05527_01 – STARTER.twbx. Use the worksheet called Tree Map, and connect to the Data (Modified Gapminder Population) data source.
How to do ...
Get Tableau 10 Business Intelligence Cookbook now with the O’Reilly learning platform.
O’Reilly members experience books, live events, courses curated by job role, and more from O’Reilly and nearly 200 top publishers.

