Creating a bar chart
Bar charts represent numeric values as bars, split across clear categories. Bar charts are very effective charts for comparing magnitudes, and spotting highs and lows in the data.
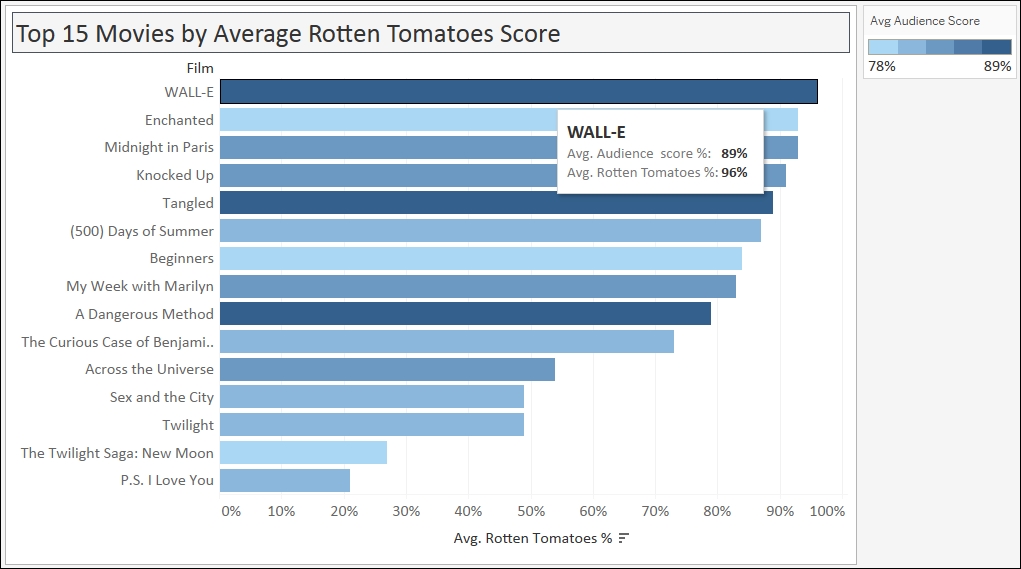
In this recipe, we will create a bar chart that shows the top 15 movies in 2007-2011 by Average Rotten Tomatoes Score.
Getting ready
To follow this recipe, open B05527_01 – STARTER.twbx file. Use the worksheet called Bar, and connect to the HollywoodMostProfitableStories data source.
How to do it...
The following are the steps to create the top 15 movies ...
Get Tableau 10 Business Intelligence Cookbook now with the O’Reilly learning platform.
O’Reilly members experience books, live events, courses curated by job role, and more from O’Reilly and nearly 200 top publishers.

