7
The Enigmatic Performance of the Japanese Yen
As one looks across the performance of globally significant asset classes there are a number which appear to be counter intuitive; one of the most surprising must be the performance of the Japanese yen against the US dollar. Figure 7.1 displays the price development of the yen against the dollar – it is inverted to show the yen as the base currency unlike the more customary pattern of USD/JPY (as it is typically quoted in forex transactions).
Figure 7.1 Japanese yen/US dollar exchange rate monthly since 1998
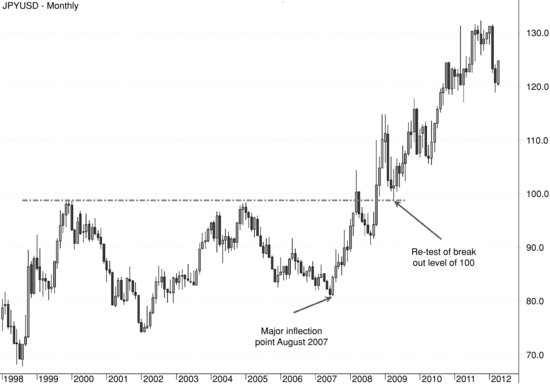
Figure 7.1 covers the period from January 1998 until the end of April 2012, during which time the yen strengthened by approximately 62% against the US currency. A fair characterization of the pattern from the beginning of 1998 up until August 2007, the “unofficial” onset of the financial crisis, would be to describe it as one of being range bound between approximately 75 and 100. But as the annotation on the chart makes clear there is a noticeable inflection point in August 2007 from which level the yen has moved consistently upwards against the dollar. Just one further comment on the chart is to note that in the first half of 2009 the yen retreated back to a re-test of the 100 level, which was the break out level from the previously mentioned range, and the re-test validated the yen’s strength; clearly the previous resistance ...
Get Systemic Liquidity Risk and Bipolar Markets: Wealth Management in Today's Macro Risk On/Risk Off Financial Environment now with the O’Reilly learning platform.
O’Reilly members experience books, live events, courses curated by job role, and more from O’Reilly and nearly 200 top publishers.

