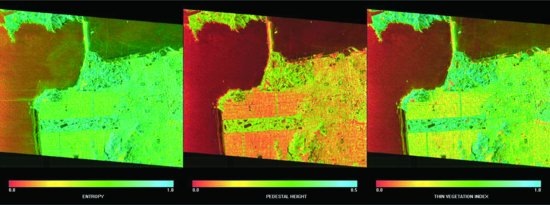
FIGURES 3.1 L-band randomness images of San Francisco acquired with the NASA/JPL AIRSAR system. The Golden Gate Bridge is visible in the top center of the image linking the Presidio of San Francisco to the Golden Gate National Recreational Area north of the entrance to San Francisco Bay. Golden Gate Park is the rectangular feature in the lower half of the image in the left portion of the city. The image on the left shows the entropy scaled from 0 to 1. The middle image shows the pedestal height scaled from 0 to 0.5. The image on the right shows the RVI scaled from 0 to 1.
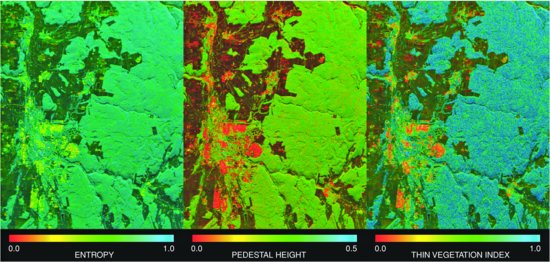
FIGURES 3.3 L-band randomness images of the area shown in Figure 3.2. Forested areas show the highest amount of randomness.
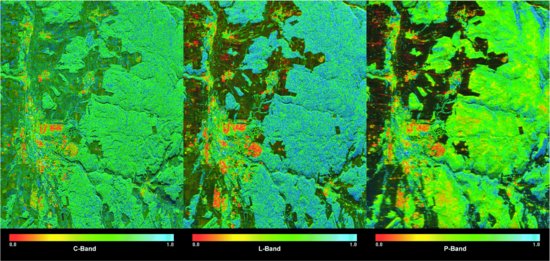
FIGURES 3.4 Radar vegetation index images of the area shown in Figure 3.2 for different frequencies. See the text for a discussion of the images.
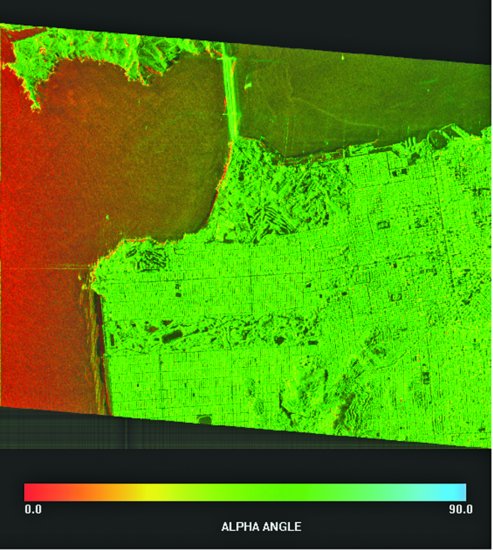
FIGURES 3.7 Alpha angle for the San Francisco image. See the text for discussion.
FIGURES 3.8 Multifrequency alpha angle for the Black Forest image. See the text for discussion.
FIGURES 3.9 Color overlay of San Francisco displaying |S

