CHAPTER 10
Day Trading Chart Patterns
Day trading chart patterns is an exercise in patience. If you use the opening gap setup to trade in the morning, chart pattern setups will occupy the afternoon. Chart patterns take time to form and confirm as valid patterns. Thus, they appear around noon or later. By using the measure rule along with pattern recognition, you can determine how much money you are likely to make and gauge the risk before trading. That is valuable information. Let us take a closer look at several setups. All of the charts in this chapter use the 5-minute scale.
DAY TRADING DOUBLE TOPS
Figure 10.1 shows a chart pattern called a double top at A and B. The two peaks are uneven, but close enough to be worth trading. Perfect patterns are rare, but imperfect ones, like that shown, are as plentiful as hair on a gorilla.
FIGURE 10.1 A double top tells that the stock is going down.
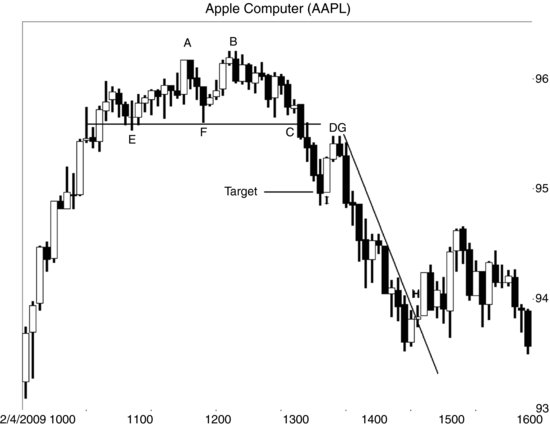
The double top confirms as a valid one when price closes below the bottom of the pattern (F), which happens at C. I drew a horizontal line beneath the pattern’s low price to highlight confirmation.
An order to short the stock placed a penny below the line gets you into the trade in a timely manner.
How far might price drop? Use the height of the chart pattern to help gauge the decline. Take the difference between the top at B (the higher of the two peaks) and the low at F (the lowest valley ...
Get Swing and Day Trading: Evolution of a Trader now with the O’Reilly learning platform.
O’Reilly members experience books, live events, courses curated by job role, and more from O’Reilly and nearly 200 top publishers.

