CHAPTER 10
Section 10-2
10-1. a) 1) The parameter of interest is the difference in means μ1 – μ2. Note that Δ0 = 0.
2) H0 : μ1 – μ2 = 0 or μ1 = μ2
3) H1 : μ1 – μ2 ≠ 0 or μ1 ≠ μ2
4) The test statistic is
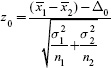
5) Reject H0 if z0 < –zα/2 = –1.96 or z0 > zα/2 = 1.96 for α = 0.05.
6) ![]() 1 = 4.7
1 = 4.7 ![]() 2 = 7.8
2 = 7.8
σ1 = 10 σ2 = 5
n1 = 10 n2 = 15
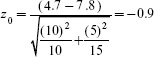
7) Conclusion: Because –1.96 < –0.9 < 1.96, do not reject the null hypothesis. There is not sufficient evidence to conclude that the two means differ at α = 0.05.
P-value = 2(1 – Φ(0.9)) = 2(1 – 0.8 159 50) = 0.36 8
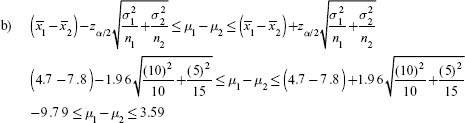
With 95% confidence, the true difference in the means is between –9.79 and 3.59. Because zero is contained in this interval, we conclude there is no significant difference between the means. We fail to reject the null hypothesis.
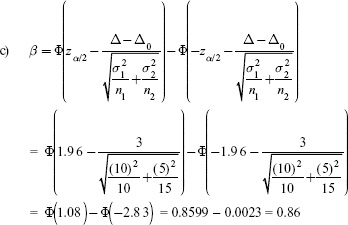
Power = 1 – 0.86 = 0.14
d) Assume the sample sizes are to be equal, use α = 0.05, ...
Get Student Solutions Manual Applied Statistics and Probability for Engineers, Fifth Edition now with the O’Reilly learning platform.
O’Reilly members experience books, live events, courses curated by job role, and more from O’Reilly and nearly 200 top publishers.

