Chapter 3
Focusing on Chart Settings
IN THIS CHAPTER
![]() Introducing chart attributes
Introducing chart attributes
![]() Picking overlays for the price panel
Picking overlays for the price panel
![]() Placing indicators above and below the price panel
Placing indicators above and below the price panel
How you set up your chart enables you to get a clear picture of a stock’s trend. In this chapter we show you how to use the flexibility of charting to build a useable display using three key components: chart attributes, overlays, and indicators.
In Figure 3-1 from StockCharts.com, you can see that the place for setting parameters, known as the workbench, is below the chart. You can access this tool for setting up charts online at stockcharts.com/freecharts/ under SharpCharts. You can then work through the steps online as we describe the process.
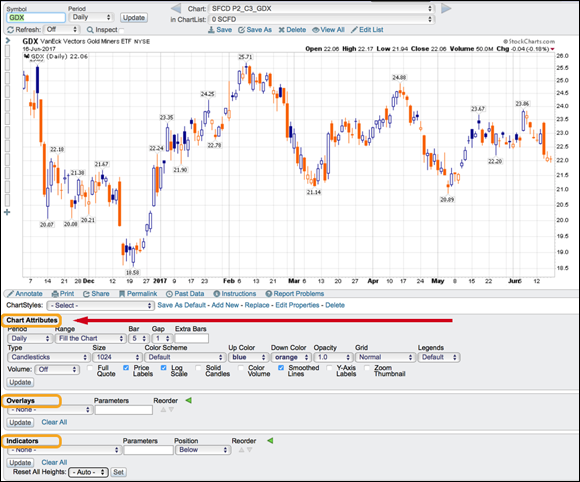
Chart courtesy of StockCharts.com
FIGURE 3-1: Where to find chart attributes, overlays, and indicators.
Choosing Chart Attributes
Chart attributes give you the primary choices for how you want to set up your chart. Chart attributes define things like the size and shape, the type of price display and color, and the background. Because there are different price display types ...
Get Stock Charts For Dummies now with the O’Reilly learning platform.
O’Reilly members experience books, live events, courses curated by job role, and more from O’Reilly and nearly 200 top publishers.

