Enhancing the Plot
Specifying the Axes Labels
Sometimes you might want to supply
additional information about the axes. You can enhance the plot by
specifying the labels for the vertical and horizontal axes.
The following program
plots the log transformation of DowJonesHigh for each year and uses
the LABEL statement to change the axes labels:
proc plot data=highlow; plot LogDowHigh*Year;label LogDowHigh='Log of Highest Value'Year='Year Occurred';title 'Dow Jones Industrial Average Yearly High'; run;
The following output
shows the plot:
Display 30.4 Specifying the Labels for the Axes
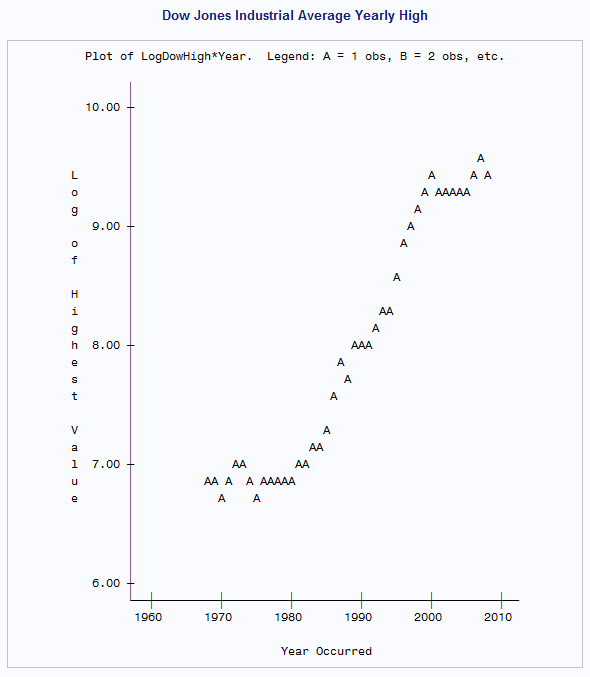
Plotting the log transformation of DowJonesHigh changes ...
Get Step-by-Step Programming with Base SAS 9.4 now with the O’Reilly learning platform.
O’Reilly members experience books, live events, courses curated by job role, and more from O’Reilly and nearly 200 top publishers.

