11.2. Z VALUE
The standardized normal distribution table (Figure 11-7) is one way to get probability values to use on any normal process or set of data. The Z in the table refers to the number of sigma to the right of the center. The probabilities refer to the area to the right of the Z point.
Figure 11-7. Standardized normal distribution table
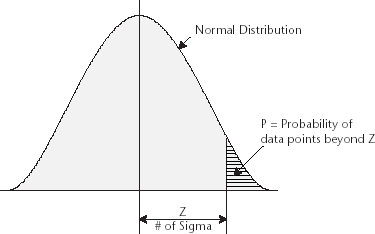
Be aware that some tables (and computer programs) use different reference points, so examine tables and computer programs carefully before using. Satisfy yourself that you can find data points on the standardized normal distribution table (Figure 11-7) relating to the previous shaft histogram with 0.0001" ...
Get Statistics for Six Sigma Made Easy now with the O’Reilly learning platform.
O’Reilly members experience books, live events, courses curated by job role, and more from O’Reilly and nearly 200 top publishers.

