24Stoppa Distribution
What is generally described as the Stoppa distribution[15] is the second of five types. Three of the five were also published by others, are better known under different titles and so described elsewhere in this book.
24.1 Type I
The Stoppa‐I distribution is commonly known as the power distribution, described later in Section 33.20.
24.2 Type II
The Stoppa‐II distribution is one of three generalisations of the Pareto‐I distribution, defined by adding the shape parameter (δ2). Its PDF is
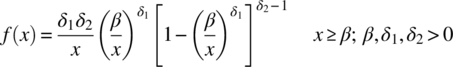
Setting δ2 to 1 (and δ1 to δ) gives the classic Pareto distribution described by Equation (23.1). Figure 24.1 shows this, as the coloured line, and the effect of increasing it above this value.
Figure 24.1 Stoppa‐II: Effect of δ2 on shape
The CDF is
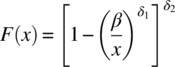
Fitting to the NHV disturbance data gives values for β, δ1 and δ2 are respectively 0, 1.01 and 379. With RSS at 0.2108 the fit is an improvement on the standard Pareto distribution but is still poor – as shown by Figure 24.2.
Figure 24.2 Stoppa‐II: Fitted to the NHV disturbance data
Inverting gives the QF ...
Get Statistics for Process Control Engineers now with the O’Reilly learning platform.
O’Reilly members experience books, live events, courses curated by job role, and more from O’Reilly and nearly 200 top publishers.

