16Regression Analysis
To perform regression we first need to decide which is the independent variable (x) and which is the dependent variable (y). Used by control engineers mainly to develop inferential properties, the result is intended to predict the dependent property (e.g. product composition) from independent variables such as flow, temperature and pressure.
To illustrate the principle of regression analysis we will fit a straight line to three points with (x,y) coordinates (2,3), (3,9) and (7,12). To do so, we first calculate the mean values of x and y. These are respectively 4 and 8. We then calculate the total shaded area shown in Figure 16.1. This is known as the total sum of squares. As is usual, the side of each square is the vertical distance between the point and in the line, i.e. in the y direction.
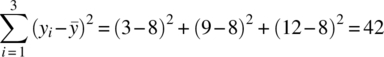
Figure 16.1 Minimisation of the total sum of the squares in y direction
Regression analysis rotates the coloured line around the point (![]() ,
,![]() ) to minimise the shaded area. In effect this minimises the difference between the predicted and actual values of the dependent ...
) to minimise the shaded area. In effect this minimises the difference between the predicted and actual values of the dependent ...
Get Statistics for Process Control Engineers now with the O’Reilly learning platform.
O’Reilly members experience books, live events, courses curated by job role, and more from O’Reilly and nearly 200 top publishers.

