Answers toSelected Exercises
3.1. (a) ![]() = 16.029. (b) s = 0.0202.
= 16.029. (b) s = 0.0202.
3.5. (a) ![]() = 952.9. (b) s = 3.7.
= 952.9. (b) s = 3.7.
3.7. (a) ![]() = 121.25. (b) s = 22.63.
= 121.25. (b) s = 22.63.
3.15. Both the normal and lognormal distributions appear to be reasonable models for the data.
3.17. The lognormal distribution appears to be a reasonable model for the concentration data.
3.23. (a) ![]() = 89.476. (b) s = 4.158.
= 89.476. (b) s = 4.158.
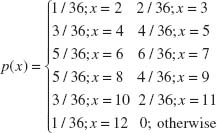
3.27. sample space: {2, 3, 4, 5, 6, 7, 8, 9, 10, 11, 12}
3.29. (a) 0.0196. (b) 0.0198.
(c) Cutting occurrence rate reduces probability from 0.0198 to 0.0100.
3.31. (a) k = 0.05. (b) µ = 1.867, σ2 = 0.615.
(c) F(x) = {0.383; x = 1 0.750; x = 2 1.000; x = 3
3.33. (a) Approximately 11.8%. (b) Decrease profit by $5.90/calculator.
3.35. Decision rule means 22% of samples will have one or more nonconforming units.
3.37. 0.921
3.43. (a) 0.633. (b) 0.659. Approximation is not satisfactory.
(c) n/N = 0.033. Approximation is satisfactory.
(d) n = 11
3.45. Pr{x = 0} = 0.364, Pr{x ≥ 2 } = 0.264
3.47. Pr{
Get Statistical Quality Control, 7th Edition now with the O’Reilly learning platform.
O’Reilly members experience books, live events, courses curated by job role, and more from O’Reilly and nearly 200 top publishers.

