10.10 Hypothesis Tests for The Population Proportion (of Successes) p
Suppose we extract a random sample of size n (>30) from a binomial population and we seek to test a hypothesis about p, the population proportion of successes. Under H0: p = po, we know that, for a binomial random variable X,

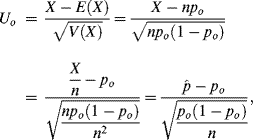
Let us construct our standardized test statistic as
which is N(0,1) distributed for large n. Here Equation (10.1) serves as the calculated value of our test statistic under H0: p = po (assumed true).1
Looking to the types of tests, we have the following:
![]()
Figure 10.12 Upper-tail critical region.
Figure 10.13 Lower-tail critical region.
In this instance,
Get Statistical Inference: A Short Course now with the O’Reilly learning platform.
O’Reilly members experience books, live events, courses curated by job role, and more from O’Reilly and nearly 200 top publishers.


