Exercises
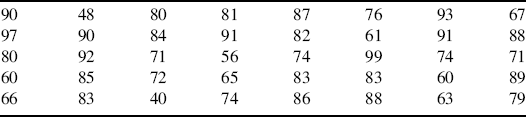
1. Given the following n = 25 observations on a variable X, find:
a. Absolution frequency distribution for X.
b. Relative frequency distribution for X.
c. Percent distribution for X.
d. Graph the absolute and relative frequency functions for X.
e. Graph the percent function for X.
![]()
2. Table E.2.2 provides observations on a variable X (the weight, in grams, of n = 40 samples of wheat).
Table E.2.2 Observations on a Variable X
a. What is the range of this data set?
b. Suppose we decide to use six classes. What is the class interval?
c. Suppose the first class has limits 40–49. Determine the limits of the remaining five classes.
d. Construct absolute and relative frequency distributions and the percent distribution for X.
e. Find the class marks and class boundaries.
f. Graph the absolute and relative frequency histograms along with the percent histogram for X.
3. If the class limits for a frequency distribution are 25–28, 29–32, 33–36, 37–40, and 41–44, determine the class marks and the class boundaries. Are these classes of equal length?
Table E.2.4 Gains in Weight (in Pounds)
a. Find the range of this data set.
b. Suppose we decide on a class interval of ...
Get Statistical Inference: A Short Course now with the O’Reilly learning platform.
O’Reilly members experience books, live events, courses curated by job role, and more from O’Reilly and nearly 200 top publishers.

