Understanding Chart Geography
One other area that I would like to discuss briefly before we actually tackle the creation of a chart is to define some of the terminology that you should be familiar with related to the different areas and items that make up a chart. Figure 10.5 shows where these various items reside on a chart.
Figure 10.5. Understanding chart geography will help you create your charts correctly.
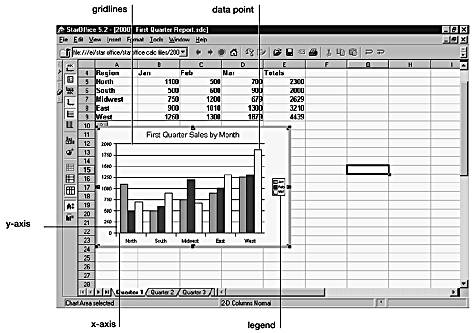
Axis— An axis is basically one side of the chart. Since most of the charts you create will be two-dimensional charts (such as line charts or bar charts), this means that there will be two axes. The x-axis contains the labels that relate ...
Get StarOffice™ 5.2 Calc Handbook now with the O’Reilly learning platform.
O’Reilly members experience books, live events, courses curated by job role, and more from O’Reilly and nearly 200 top publishers.

