Time for action – generating graphical reports with Calamaris
Now, let's learn to generate HTML and graphical statistics using Calamaris. To generate graphical stats, we need to create a directory where Calamaris can dump image files. So, let's see how it works:
$ mkdir stats
$ cat access.log  | calamaris -a --output-file access_stats.html -F html,graph --output-path ./stats/
The previous command will generate an access_stats.html file along with a few image files in the stats directory. Let's have a look at a few images from the stats directory:
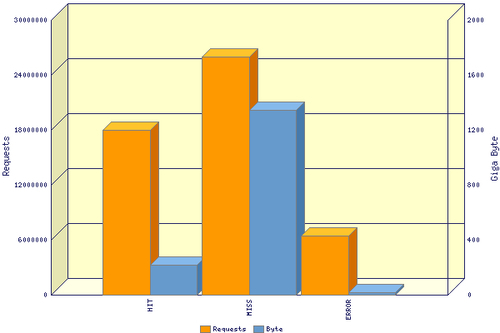
This image is a graph of TCP requests by the Squid status. On the left-hand side is a scale representing ...
Get Squid Proxy Server 3.1 Beginner's Guide now with the O’Reilly learning platform.
O’Reilly members experience books, live events, courses curated by job role, and more from O’Reilly and nearly 200 top publishers.

