You can have Splunk overlay a field value on top of your existing chart to provide trendlines and so on. Add the following line to the end of the inline search used for the Sessions Over Time search:
| eventstats avg(dc(JSESSIONID)) as average | eval average=round(average,0)
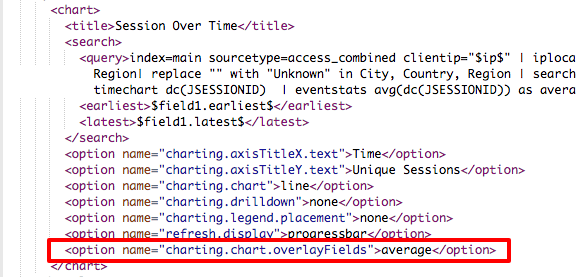
Then, add the following line to the Simple XML of the panel:
<option name="charting.chart.overlayFields">average</option>
The following screenshot illustrates this process:
It will then add a line that charts the average of the session count over top of the actual values, as shown in the following screenshot:
The chart ...

