Introducing the Gantt Chart View
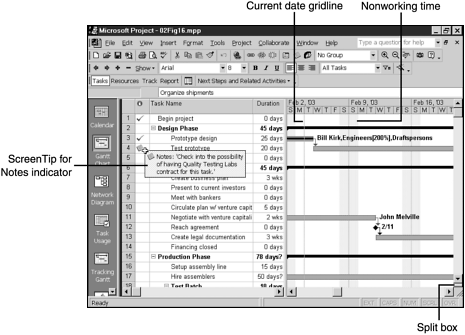
The default view for a new project is the Gantt Chart view (shown in Figure 2.15). This is the most often used view for listing project tasks.
Figure 2.15. The Gantt Chart view is the most often used view in Microsoft Project because it shows both the outlined structure of the task list and the timescale for tasks.

The Gantt Chart view is a graphical view that contains a table on the left side and a bar chart (known as the timescale) on the right side. The table displays the task list, which includes, by default, the name and duration of each task. The table also contains additional columns that are hidden behind ...
Get Special Edition Using Microsoft® Project 2002 now with the O’Reilly learning platform.
O’Reilly members experience books, live events, courses curated by job role, and more from O’Reilly and nearly 200 top publishers.

